Screens
Key Screens
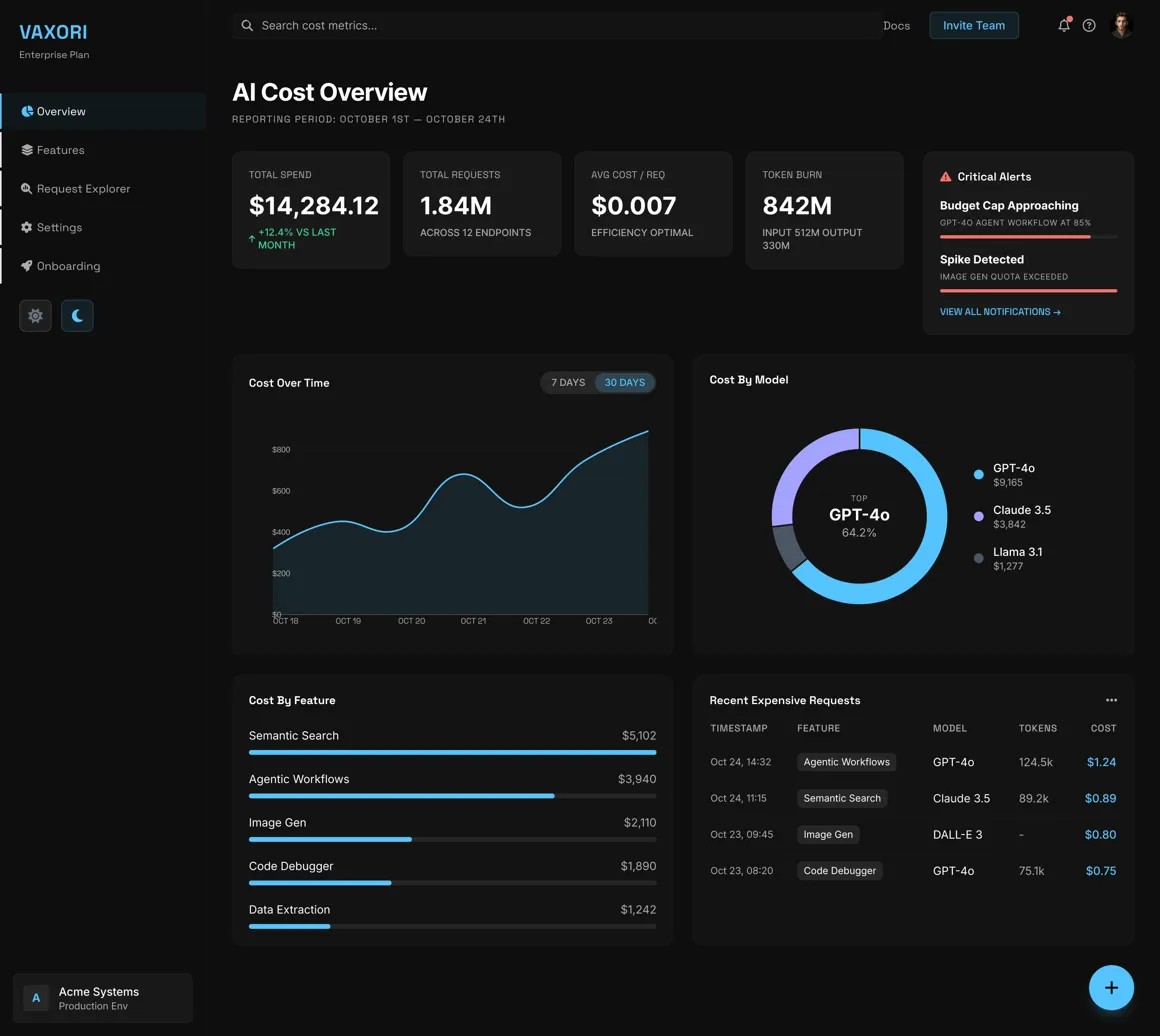
Dashboard
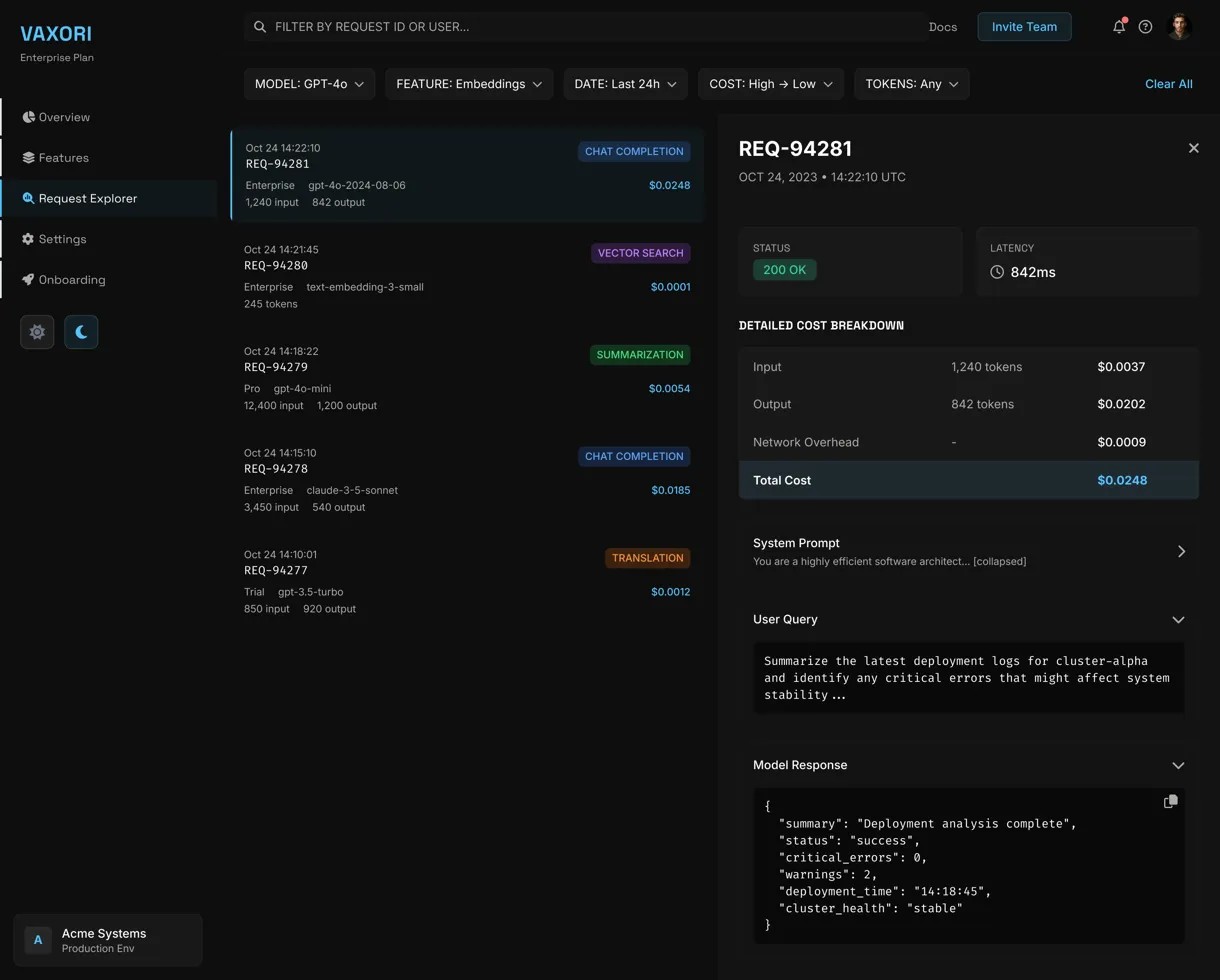
Request Explorer
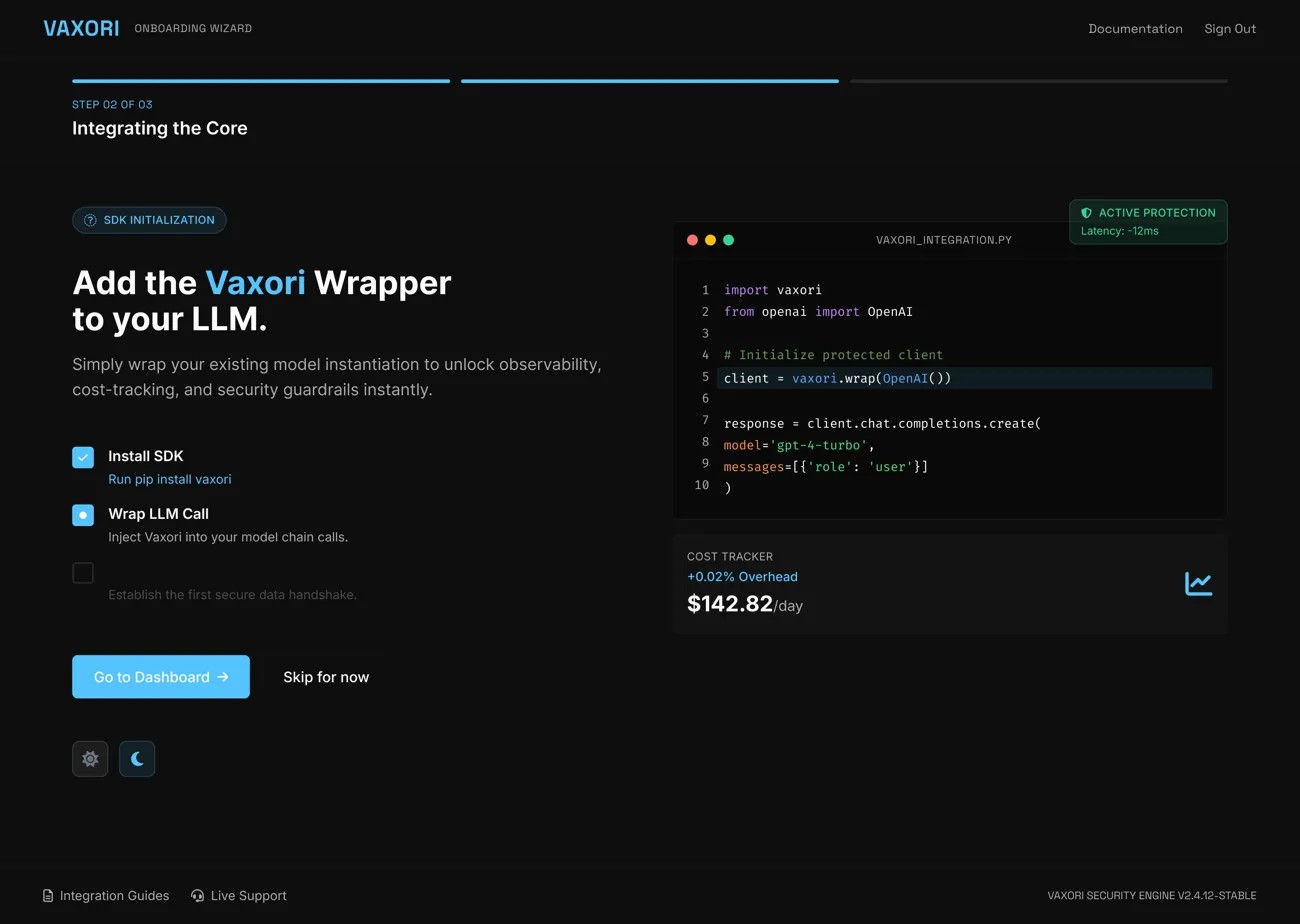
Onboarding
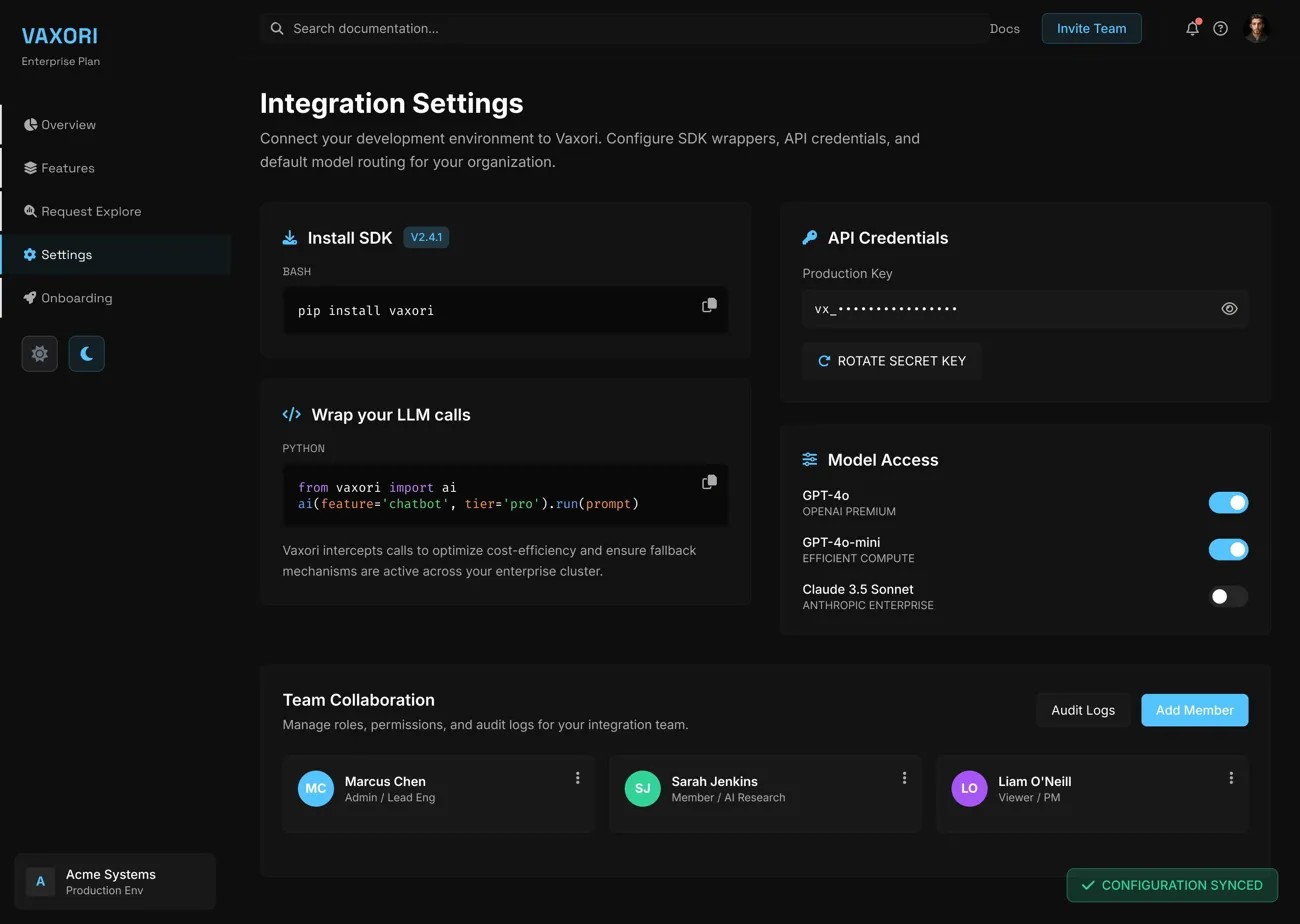
Settings
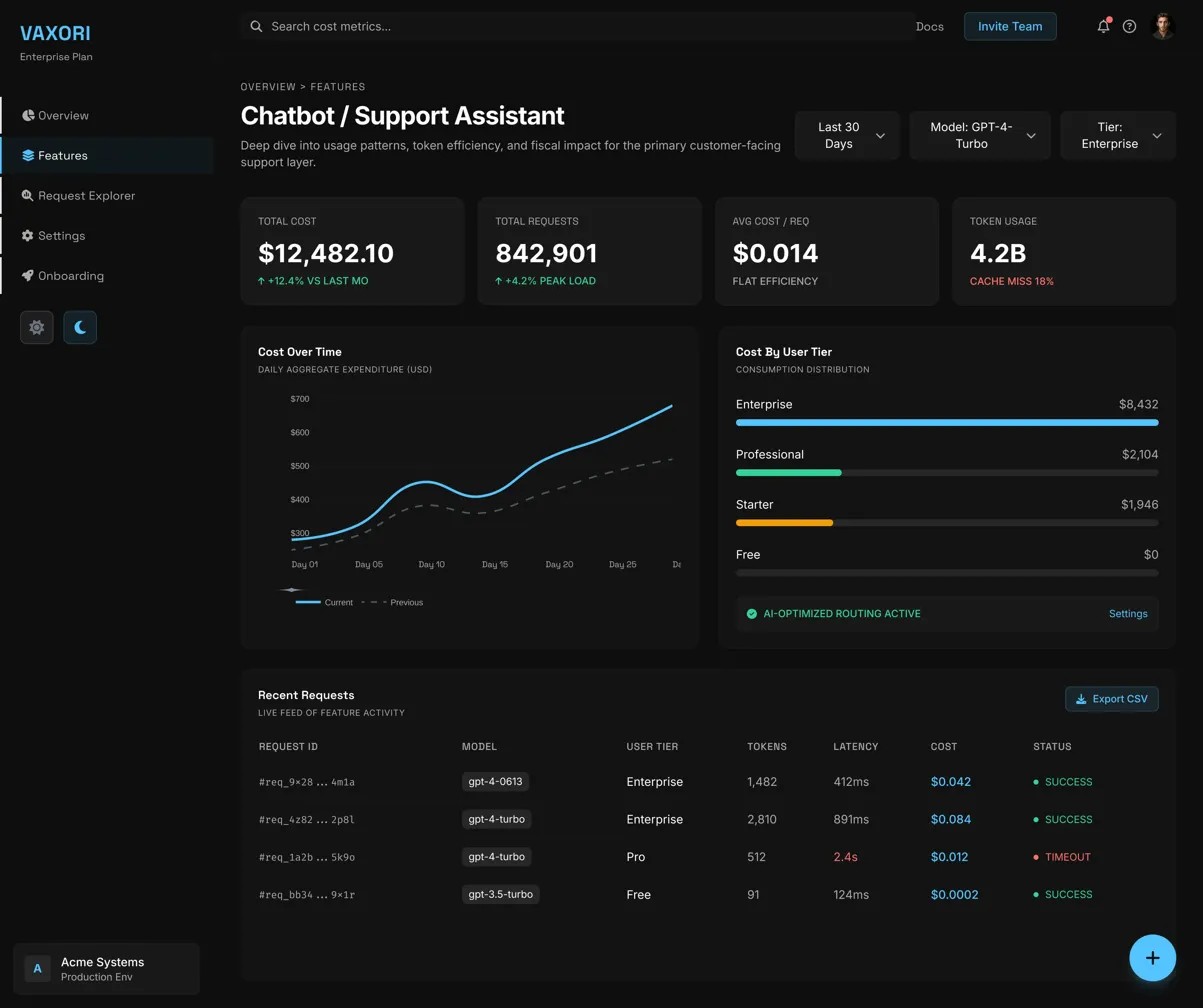
Feature Breakdown
See every dollar your AI spends — before it surprises you. A cost intelligence dashboard for teams running LLMs in production.
As companies started running LLMs in production at scale, a pattern emerged: engineering teams would ship a feature, usage would spike, and weeks later finance would ask why the cloud bill doubled. There was no real-time visibility into what was expensive, which models were wasteful, or which product features were quietly burning budget. Vaxori needed to give teams the right data — without burying them in charts they'd never act on.
The 8-view dashboard was designed to serve two distinct mental models: engineering leads who track request volume and model performance, and finance/ops teams managing spend against budget. Information hierarchy was the core design challenge — the system needed to be dense without being noisy, surfacing cost anomalies within the first five seconds of opening. The 40+ component dark mode system gave the engineering team a complete, production-ready handoff they could build from without a designer in the loop.
Dashboard
Request Explorer
Onboarding
Settings
Feature Breakdown